Dashboard

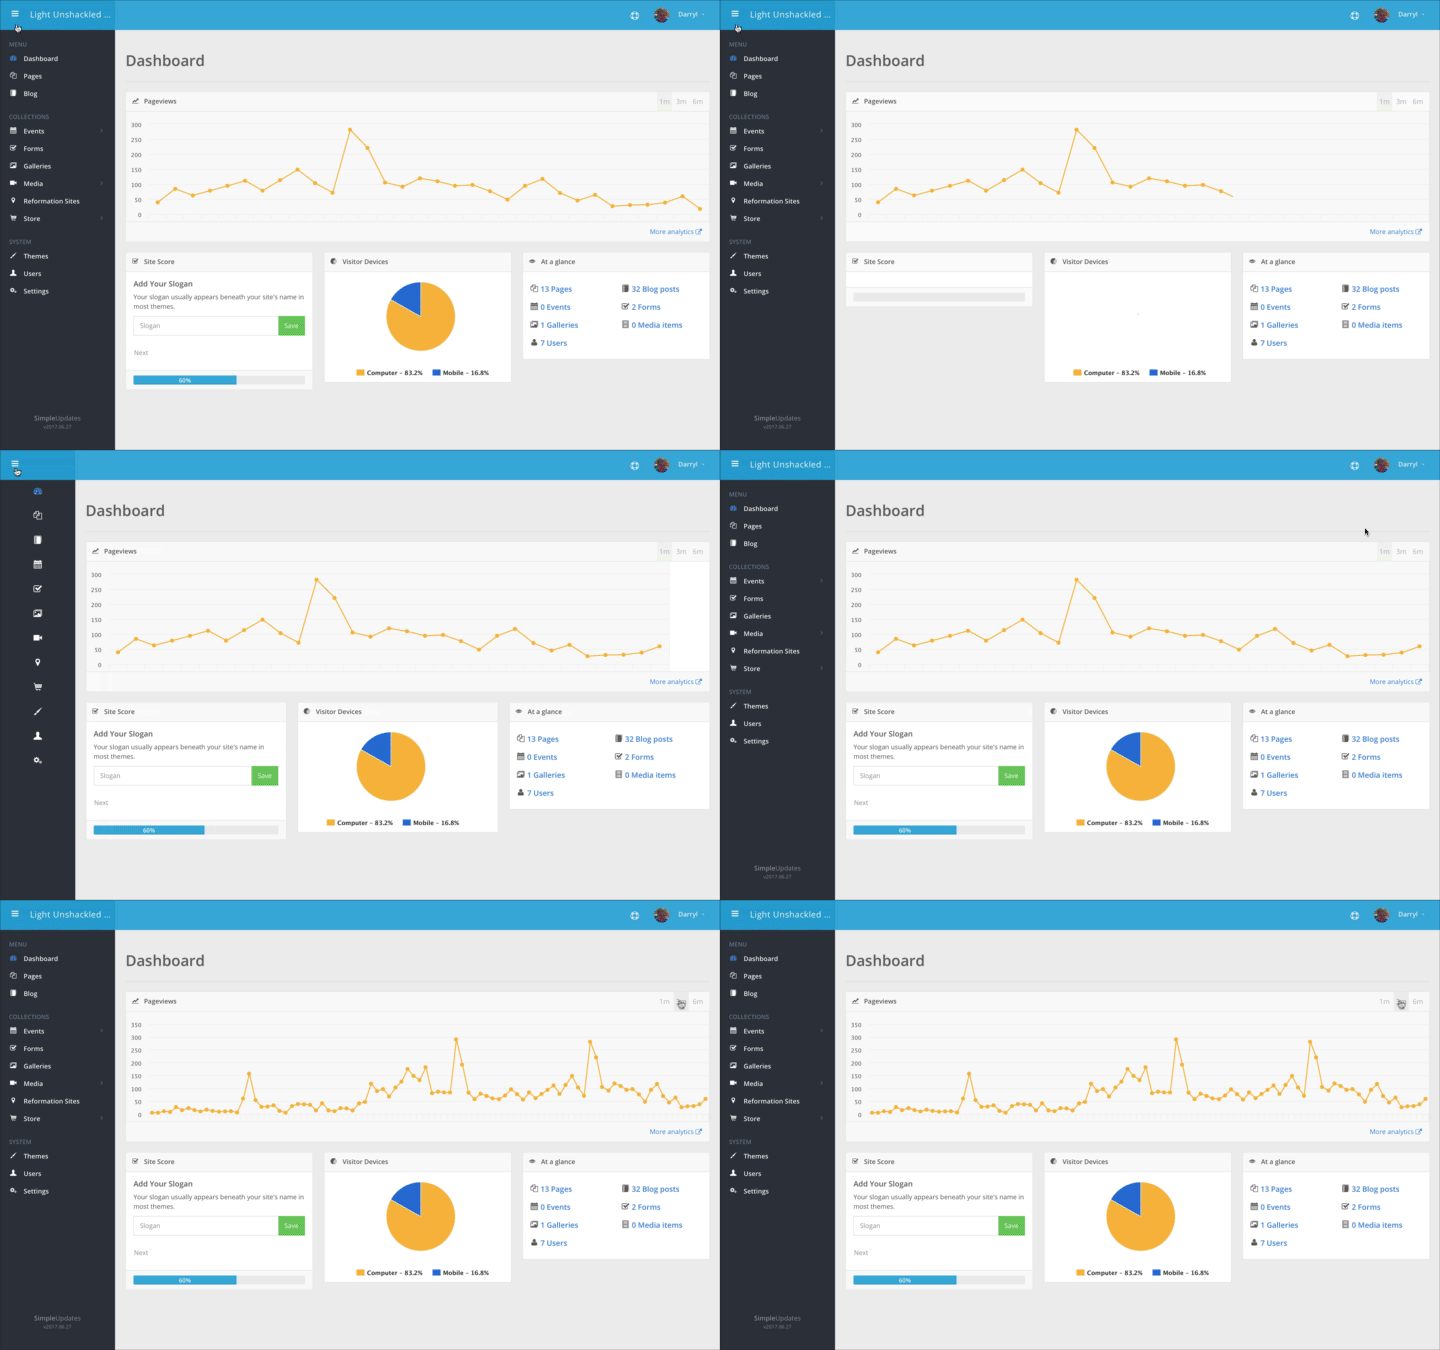
Pictured here is the website dashboard. This page is an overview area of your website. Check here for system messages and alerts for items that may need your attention.
Using the Dashboard, you can view several numbers and statistics related to your site, such as how many page views you have received over a given period of time.
Line Graph
At the top is a line graph. This graph tracks all the Page visits to your website. You may set the view to
- one month
- three months or
- six months
Hover over any part of the line and a small popup will tell you the date and page views represented by that part of the line.
To the bottom right is a text link for 'More Analytics'
By default this will give you information collected by Webalizer version 2.23.
If you have integrated your site with Google Analytics, the same 'More Analytics' link will connect you with your Google Analytics account.
Site Score

The site score is a tool you can use to improve your site's Search Engine Optimization. The system tracks the various edits you make on your website and uses the information to give your website a score that suggests how search engines also see your website.
The highest score you can get is a 6.
The system displays five types of edits. Each one lists the number of each type of edit made on your site in the last 30 days.
- blog / pages
- calendar events
- media items
- photo galleries
- forms
Setup Progress
As you begin to setup your website, the Setup Progress will give you suggestions of things that still need to be done to complete the site setup process.
There is a bar at the bottom that calculates the percentage of completion.
Keep in mind that even after the site is 100% setup, you will need to make frequent edits to keep your Site Score at 6.
Visitor Devices
All SimpleUpdates websites and the Themes used on them are designed to be responsive, aka mobile friendly. The website display will automatically adjust to the size of the screen on which it is being viewed.
Included on the dashboard is a pie chart indicating how many site visitors are using a computer and how many are using a mobile device to view your site.
At a Glance
Your website in a nutshell. Want to know the basic makeup of your site? Take a Glance.
Related Information
Dashboard
Pages
Blog
Events (Calendar)
Forms
Galleries
Media
Store
Themes
Users
Settings
Group Pages
Navigating This Website
Black Admin Bar on Left
Blue Control Bar at Top
Basic Editing
Don't Stay Invisible.
Get noticed. Don’t blend into the background.
Take action today and start building.
© Copyright 2002-2025 SimpleUpdates.com Inc., All Rights Reserved
About
Acceptable Use Policy
Privacy Policy
Terms of Service


